Blog · Education
Lead-to-Enrolment Funnel Math for Certification Course Providers
Rishabh · 22 Oct 2026

Ask five certification providers in Indore what their funnel looks like and you will hear five different stage lists and, if you are unlucky, one borrowed benchmark: some percentage a vendor blog printed with no method behind it. This article skips the borrowed numbers. It shows you how to build the funnel from your own records, which stages to separate, the formulas that connect them and how to find the stage where your money is leaking, so every figure in your plan is yours.
Why you should not borrow a funnel benchmark
Search for certification funnel benchmarks and you will find demo show-up rates, trial-to-paid rates and first-call connect rates quoted with great confidence. Look closer and they come from vendor blogs, often attributed to an unnamed growth head, with no sample, no period and no definition of what a lead or a demo is. Those figures appear in sales material for voice-automation and CRM tools, and they are not an independent survey. So none are reproduced here.
There is a more practical reason too. Funnel numbers depend on definitions. One provider counts a form fill as a lead, another counts only a person who answered the first call. One counts a demo as attended after five minutes, another after thirty. Two teams quoting a "demo show-up rate" may be measuring different things. What you can compare is your own funnel this month against your own funnel last month, with definitions held constant.
The approach below works for a university certificate programme, a professional-certification training partner or an ed-tech cohort alike, because it is only arithmetic: stages, ratios and a handful of questions about where people disappear.
The stages worth separating
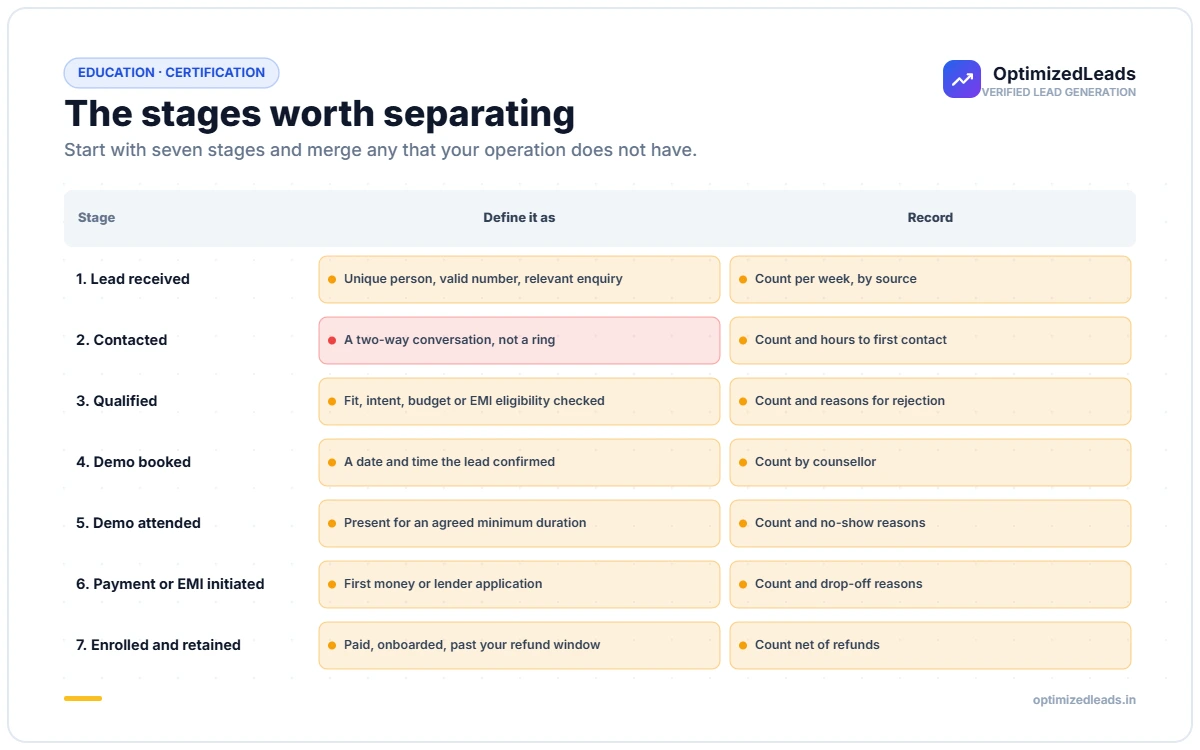
Start with seven stages and merge any that your operation does not have. The point of the table is the middle column: write the definition down before you count anything.
| Stage | Define it as | Record |
|---|---|---|
| 1. Lead received | Unique person, valid number, relevant enquiry | Count per week, by source |
| 2. Contacted | A two-way conversation, not a ring | Count and hours to first contact |
| 3. Qualified | Fit, intent, budget or EMI eligibility checked | Count and reasons for rejection |
| 4. Demo booked | A date and time the lead confirmed | Count by counsellor |
| 5. Demo attended | Present for an agreed minimum duration | Count and no-show reasons |
| 6. Payment or EMI initiated | First money or lender application | Count and drop-off reasons |
| 7. Enrolled and retained | Paid, onboarded, past your refund window | Count net of refunds |
Two stages deserve special care. Stage 3 is where lead quality shows up: a lead that looks fine at stage 1 can turn out to be a student collecting free material, a person with the wrong skill background or someone without the budget or the EMI eligibility. Stage 7 should be counted after your refund window, not at the moment of payment, otherwise a high-pressure month looks better than it was. The lead quality scorecard helps you grade stages 1 to 3 consistently.
The formulas that connect the stages
Every conversion rate is the count at one stage divided by the count at the stage before it. Keep two kinds of numbers apart: step rates (stage 3 over stage 2) tell you where the leak is, and end-to-end rate (stage 7 over stage 1) tells you what a lead is worth.
- Step rate = people reaching stage n / people reaching stage n-1.
- End-to-end rate = enrolled and retained / leads received. It equals the product of all the step rates.
- Leads needed for a target = target enrolments / end-to-end rate.
- Cost per enrolment = total cost of the funnel in the period / enrolled and retained, which is the number the next article compares with cost per lead.
The product relationship is the most useful part. If stage 2 drops by a fifth, the end-to-end rate drops by a fifth, no matter how well the later stages perform. That is why fixing a small leak at the top is often worth more than a heroic effort at the bottom: every later stage works on whatever the earlier stage lets through.
Use cohorts, not just calendar months. A lead received on the 28th may not reach stage 6 until the following month, so a simple month-to-month ratio understates conversion in a growing month and overstates it in a shrinking one. Tag each lead with its week of arrival and follow that cohort for as long as your sales cycle runs.
A worked example with round placeholders
Illustrative, replace with your numbers. Suppose a provider receives 1,000 leads in a period. Suppose 600 are contacted, 300 qualify, 150 book a demo, 100 attend, 40 start payment or an EMI application and 30 are still enrolled after the refund window. These round figures are placeholders and describe no real provider.
The step rates are then 60% (contacted), 50% (qualified), 50% (booked), about 67% (attended), 40% (payment started) and 75% (retained). The end-to-end rate is 30 / 1,000 = 3%. To enrol 60 learners in the next period at the same rates, you would need 2,000 leads.
Now see what a change does. If better first-contact discipline lifted stage 2 from 60% to 70%, the end-to-end rate would rise to 3.5%, and 60 enrolments would need roughly 1,714 leads instead of 2,000. If instead demo attendance improved from two thirds to 80%, the end-to-end rate would also rise to 3.6%. Notice that both fixes are cheap compared with buying 300 more leads, and both are worth testing first.
Now check the other side. If the 400 leads that were not contacted were mostly wrong numbers, duplicates or unreachable, the leak is not the team: it is the supply. In that case, counsellor training will do little, and the answer is to change what enters stage 1. That is the point where sourcing matters, and where a plan that supplies leads worked from existing data and replaces invalid ones, under terms agreed in writing, can change the math. Confirm the current definition of invalid and the window before relying on it.
Where certification funnels usually leak
Without inventing a benchmark, there are recurring patterns you can look for in your own data.
Between stage 1 and stage 2. Slow or failed first contact. Check the hours between lead arrival and first real conversation, by source and by counsellor. US research by Oldroyd, McElheran and Elkington in the Harvard Business Review (March 2011; bibliographic record at BYU ScholarsArchive) found most companies respond too slowly to web leads. It is American and old, so read it as direction only. The setting of your own standard is covered in speed to lead.
Between stage 2 and stage 3. Poor fit. Many certification enquiries come from people who wanted free material, whose skills do not match the programme, or who cannot afford it. Record the rejection reason in a fixed list so you can count it. Signals that distinguish a real enquiry from a curious click are the subject of the intent and fit signals article.
Between stage 4 and stage 5. No-shows. Booking a demo is not the same as getting someone into it. Measure the reasons: wrong time, forgot, never intended to attend, or had no clear reminder.
Between stage 5 and stage 6. Fee and EMI. If the programme is financed, the lender's checks and application steps add friction. Where a bank or NBFC finances the fee, RBI's Digital Lending Directions of May 2025 require a Key Fact Statement and disclosure of the real cost to the borrower, as law-firm summaries such as Argus Partners describe. Confirm with counsel how it applies to your checkout. Dropping from stage 5 to stage 6 is the subject of its own article.
After stage 7. Refunds. A funnel that looks healthy at payment and loses learners in the first weeks is a promise problem, usually an overpromised outcome.
How this plays out in Indore and other tier-2 cities
The funnel has the same stages in Indore as anywhere; what changes is where the leaks tend to appear, and the research for this batch supports only a small part of that. A national IAMAI and Kantar study reported by Business Today found that most Indian internet users prefer regional-language content, with affordability among the stated barriers to going online. Take that as a reason to check whether your stage 2 and stage 3 conversations happen in the language the lead is comfortable in, and whether your price conversation matches their budget.
No credible Indore-specific data was found on EMI uptake, price points, Hindi preference or demo attendance, so do not assume. Instead, split your funnel by city of origin and, if you can, by counsellor language, and compare. Working professionals may be unable to take calls during office hours, so contact attempts at times when they cannot talk could look like poor quality at stage 2. Look at the time of day of your first successful contacts before you blame the lead.
Calling rules also touch the funnel. TRAI notified a third amendment to its telecom commercial communication rules on 18 September 2026, which per the PIB release allows inquiry-based commercial communication for seven days from the customer's inquiry if the inquiry is written or digital and kept verifiable. The commencement date was not stated in the release and the rule is recently notified, so check the current text with counsel. If it applies to you, it is one more reason to move quickly from stage 1 to stage 2 and to keep a record of the enquiry. This is not legal advice; verify with counsel and the regulator.
Using the funnel to decide between fixing and buying
Once you have your step rates, you can answer a decision that otherwise feels like guesswork: do we need better leads, better handling, or more of both?
If stages 1 to 3 are weak while stages 4 to 7 are strong, the problem is supply quality. Your team is good at converting the people it finally reaches, but too many of the leads entering the funnel never become qualified. More calling effort will not cure that; changing the source will. If stages 1 to 3 are healthy but 4 to 6 are weak, the problem is handling: demo design, reminders, fee conversations and financing. A different lead supplier will not fix a poorly run demo.
OptimizedLeads is one option for the first problem. It supplies ready certification course leads on a plan, works new leads from existing data and includes a free CRM so your stage counts are captured as the team works. For current plans see /pricing, and for what you receive see the certification course leads page. A free two-day trial at /start-free-trial lets you push a batch through your own funnel and compare stage 2 and stage 3 rates with your current sources. Your numbers decide, not ours.
Also use the funnel to cost your operation. Divide the monthly cost of calling, which the qualified demo article helps you split by stage, by the stage counts, and you can see the cost of a contact, a qualified lead, a demo and an enrolment.
What to do this week
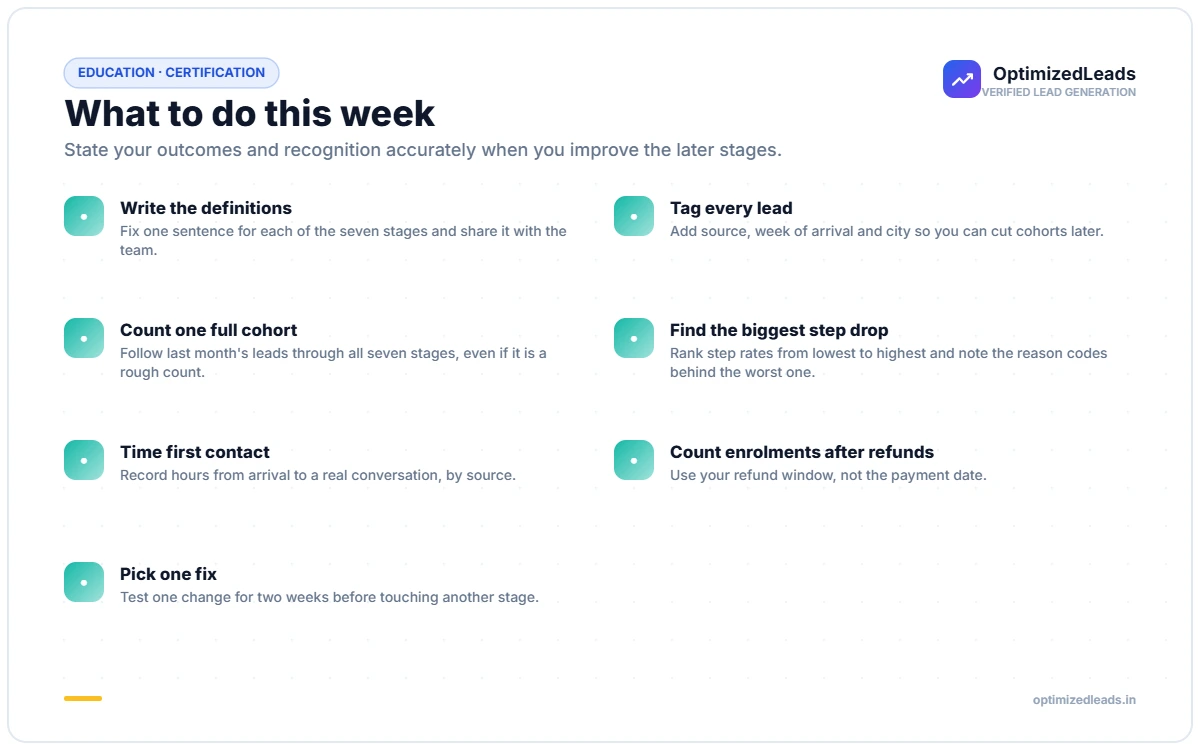
- Write the definitions. Fix one sentence for each of the seven stages and share it with the team.
- Tag every lead. Add source, week of arrival and city so you can cut cohorts later.
- Count one full cohort. Follow last month's leads through all seven stages, even if it is a rough count.
- Find the biggest step drop. Rank step rates from lowest to highest and note the reason codes behind the worst one.
- Time first contact. Record hours from arrival to a real conversation, by source.
- Count enrolments after refunds. Use your refund window, not the payment date.
- Pick one fix. Test one change for two weeks before touching another stage.
State your outcomes and recognition accurately when you improve the later stages. A funnel built on overpromising will show up as refunds, not as growth.
Sources and further reading
- BYU ScholarsArchive — bibliographic record of the 2011 HBR article on lead response (US data, direction only).
- Argus Partners — summary of RBI's Digital Lending Directions, 2025.
- PIB (Ministry of Communications) — TRAI third amendment announced 18 September 2026.
- Business Today — IAMAI and Kantar findings on regional-language preference.
Regulatory items here are not legal advice. Verify with counsel and the regulator before relying on them.
Frequently Asked Questions
What stages should a certification provider include in its funnel?
A workable list is lead received, contacted, qualified, demo booked, demo attended, payment or EMI initiated, and enrolled past the refund window. Merge stages your operation does not have. Write a one-line definition for each so every counsellor counts the same way.
Should I use industry funnel benchmarks for certification courses?
Be careful. Most published percentages for demo show-up and conversion come from vendor blogs without sample size, period or definitions. Build your own funnel and compare it with your own previous months, holding definitions constant.
How do I work out how many leads I need for a target number of enrolments?
Divide the target by your end-to-end rate, which is retained enrolments divided by leads received. If your end-to-end rate were 3%, a target of 60 enrolments would need about 2,000 leads. Replace that placeholder with your own cohort data.
How do I know if my problem is lead quality or counsellor handling?
Look at the step rates. Weak rates at contact and qualification point to supply quality, while weak rates at demo attendance, payment and EMI point to handling. Fix the weaker half first and test one change at a time.
Why count enrolments after the refund window?
Counting at payment hides refunds and rewards pressure selling. Counting after your refund window shows the learners who stayed, which is what your revenue and your reputation depend on. It also keeps the funnel honest about overpromised outcomes.
Push a batch through your own funnel and compare it with your current sources: start the free 2-day trial and see how certification course leads are supplied for providers in Indore and tier-2 cities.